Test coverage resports. Are they only for management and reporting to someone who wants “everything tested”?
A measurement of how “well” you are testing?
I say no! I think you can actually use it for several things to be more productive.
If you are not already writing tests, you might want to consider doing that. I am not going into why tests are good in this post, but there are many sources on the internet for more about just that.
What is it?
A test coverage report is a report you can get as part of you “test run” that tells you which part of your code you are covering while running your tests. It’s a tool to help you see which parts of you code you are actually testing.
It tells you how much of your program is covered. Which lines you hit, which conditionals you are going into, which of them you aren’t.
It can be used with unit tests, integration tests and even full end-to-end tests. You just run the tests and get a report back on what you covered with them.
But, what do you actually use the coverage report for?
Sure, it might be a nice tool for management to see how “tested” your application is, but that has little value for you as a developer. Or for the application it self.
I think it would be nice to use that coverage report for some really really useful things. And you can!
Finding untested parts of your application
It sounds straightforward (and it really is, but like everything, you got to be conscious about it).
You think you cover the most important logic and the most of the bad corner cases of said logic. But are you? Are you really?
Lets take an example from my Extreme Results Server:
I will use the coverage reports from my integration tests, because those are the only ones I am generating right now (even though I have lots of unit tests as well).
This is how the overall coverage report looks my controllers:
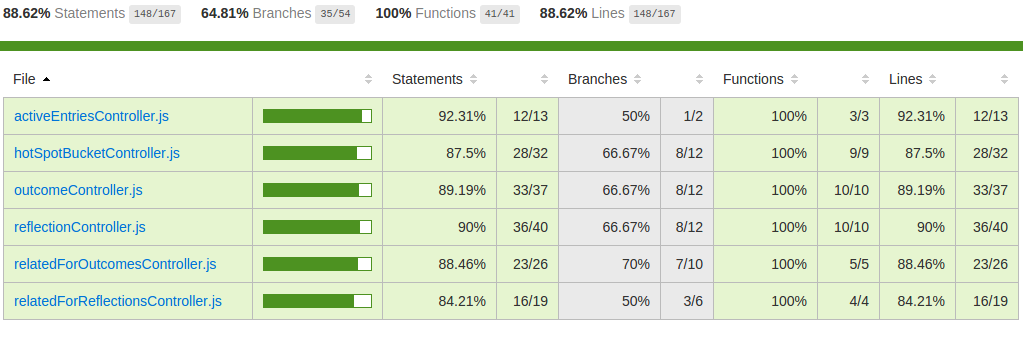
Looks pretty OK. High percentage of the code is being tested, but there are some branches not being taken. Let’s take a look at a few of those.
More specifically, let’s look at the relatedForReflectionsController.js. It has 3 out 6 branches not being taken. Sounds like there might be some corner cases hiding there.

The red parts are lines I don’t hit. You can also see the conditionals that are not being tested properly.
I am not hitting the errors that might happen in the database (Line 28 and 32). Perhaps not too easy to hit with Integration Tests, so I’ll probably leave those to the unit tests.
There is however one path that I really should have tested.
On line 4, I don’t hit the else block (the red line on line 41).
I should really write a tests that verifies that i get back a 400 status if I send in a bad typeName.
I might have missed this if I didn’t have my coverage report.
The takeaway is that you can use the coverage report to find the things your are not actually testing.
You might find quite a few test cases that you could write to better you tests.
Making a game out of it
I think the percentage part of the coverage is quite fun. It feels like a game. Something to strive for.
I tend to try to make the percentage higher for every commit. Perhaps I write a few extra tests to hit some extra lines and conditionals in the code here and there.
I actually did this to my Extreme Results Web App. I always upped the percentage. And now i have 100% test coverage on it!
I actually hit every single line of code in my application with my unit tests. That is cool! First time for me.
But beware. Just because you have lots of tests, doesn’t mean the tests are good. You also have to write good tests that will fail if your application start doing something wrong.
But that is a different topic for another day.
For now: Try to use that coverage for something useful, AND fun!
 Follow me on Twitter: @gjermundbjaanes